Essential eCommerce Metrics and KPIs You Should be Tracking for Business Growth

- What are eCommerce Metrics
- What are KPIs
- Metrics vs KPIs: What’s the Real Difference in eCommerce?
- Proven Methods to Measure eCommerce Growth
- Monitor Revenue Growth Rate
- Assess the Average Order Value (AOV)
- Track Customer Acquisition Rate and Costs
- Evaluate Conversion Rate
- Increase Customer Retention Rate
- Reduce Cart Abandonment Rate
- Evaluate Traffic and Channel Performance
- Improve Click-Through Rate (CTR)
- Minimise Return and Refund Rate
- Churn Rate
- Reduce Bounce Rate
- How Frequently Should You Track Metrics?
- Mapping the Customer Journey with Data-Driven Metrics
- How Shiprocket Checkout Helps Track and Improve Conversion Metrics
- Conclusion
A core aspect of every business revolves around tracking the relevant metrics. Without regularly tracking these numbers, businesses may fail to boost revenue. eCommerce metrics and KPIs support businesses in assessing the success rate, determining weak points, and making informed decisions for overall growth. From the total number of audiences that land on your website to the number of audiences that end up making a purchase, each phase of the client journey helps businesses calculate how well they are performing. Consequently, this enables companies to employ more robust tactics to boost earnings.
Additionally, key metrics, including average order value (AOV), conversion rate, and card abandonment, help businesses gain a competitive edge in the market. These help determine the best-selling products, which stage of the cart people abandon, and how well a marketing strategy works for your business.
For instance, a recent survey suggested that about 73.94% of individuals abandoned their shopping carts across eCommerce stores. According to this, 3 out of 4 consumers tend to leave their carts. Understanding why and at which stage they abandon their carts can help businesses strengthen their strategy and sell more efficiently.
This blog covers everything you need to know about eCommerce KPIs and how they can be beneficial when increasing brand revenue.
What are eCommerce Metrics
‘Metrics’ and ‘KPIs’ are common terms that one might hear in eCommerce or online shopping settings. But what are the key differences between these terms?
eCommerce metrics calculate various aspects of your business. From the total number of customers visiting your website to total converted sales and the stage at which customers abandon the cart, these figures play a quintessential role in the revenue generated every month.
What are KPIs
Key Performance Indicators (KPIs) are crucial metrics that represent your core. These are key figures that businesses need to grow regularly. Conversion rates, customer retention rates, and average order values are typical types of KPIs. They assess the efficacy of an organisation’s marketing, sales, and operational tactics.
In a nutshell, metrics track activity while KPIs monitor the progress of business goals.
Metrics vs KPIs: What’s the Real Difference in eCommerce?
‘Metrics’ and ‘KPIs’ are common terms that one might hear in eCommerce or online shopping settings. But what are the key differences between these terms?
Metrics are key figures that help assess how well a business is performing, while KPIs monitor how efficiently a business goal is being executed.
As for scope, metrics are comparatively comprehensive and can be classified into distinct types:
- Bounce rates
- Page visits
- Total number of audience
Conversely, KPIs represent the most relevant indicators that emphasise growth objectives like:
- Acquisition costs
- Conversion rates
When it comes to actionability, KPIs empower businesses in making informed decisions. If businesses notice a high cart abandonment rate, they can immediately take action. On the contrary, general metrics like the total time customers spend on a website may not necessarily require immediate attention.
Lastly, in terms of measurement focus, KPIs are measured against benchmarks or targets, while metrics are measured to see their alignment with trends.
Therefore, although all KPIs can be categorised as metrics, not all metrics qualify as KPIs. Businesses should focus on KPIs that are most relevant to their goals.
Proven Methods to Measure eCommerce Growth
Assessing eCommerce growth involves more than just assessing the revenue. It is more about determining the right balance of figures that can help businesses understand how to scale in the long run. From assessing customer behaviour, financial metrics, and overall performance, businesses can establish sustainability. Let’s look at a few proven tactics for tracking business growth.
Monitor Revenue Growth Rate
Businesses should regularly monitor their revenue growth rate (monthly, quarterly, and annually). This way, they can determine the influence of marketing or pricing changes and understand seasonal trends.
Assess the Average Order Value (AOV)
AOV gives you the average amount your customers spend on each order they make from your online store. A higher AOV indicates that clients are likely spending more on every transaction. Strategies such as upselling, loyalty incentives, and product development can all influence the enhancement average order value. This metric helps understand your revenue growth and how much profit you’ve made per order. It can also help you analyse trends in your customers’ buying behaviours. You can calculate AOV by using the formula below:
AOV = Total revenue / Total number of orders
Track Customer Acquisition Rate and Costs
Businesses should also regularly track how many new customers they are gaining each month. A consistent increase suggests that your outreach and advertising efforts are paying off. Similarly, businesses should also calculate the customer acquisition cost (CAC). It tells them how much they’re spending to gain each customer. You need to monitor CAC regularly to ensure long-term profitability because if your CAC is high and your customer lifetime value (CLV) is low, then you’re wasting a lot of money.
CAC = Total customer acquisition costs / Number of new customers acquired
Acquiring new customers is now significantly more expensive. However, 44% of businesses still prioritise customer acquisition over retention, while only 18% focus on keeping current customers. Brands are losing money on new customers, with CAC increasing by 222% in recent years.
Evaluate Conversion Rate
Conversion rate highlights the total number of visitors who purchased your products and services. Even a small increase in the conversion rate can result in substantial revenue boosts.
Conversion rate = (Number of purchases / Number of sessions) x 100
The conversion rate will vary depending on the industry you operate in and the channels you use to communicate and interact with your target audience, including email, social media, etc. However, you should aim for a conversion rate of around 3%.
Increase Customer Retention Rate
Customers who purchase your products and services on a regular basis suggest that your company is expanding. Customer retention rate measures the percentage of customers you can retain over a given time period. A greater retention rate leads to significantly reduced acquisition costs and more predictable revenue. When calculating the customer retention rate, you should deduct the number of new customers from the total customer count. Though the new customers you’ve acquired are essential, this eCommerce metric only focuses on how well you’re retaining your existing ones.
A good customer retention rate for any eCommerce business typically falls between 20% and 40%. However, it can vary significantly based on industry and product type. If you’re a subscription-based eCommerce business, you’re more likely to experience higher customer retention rates, around 30% to 45%. Increasing customer retention by just 5% can help you achieve substantial profit growth, around 25% to 95%. Several businesses are experimenting with AI tools to overcome the challenges of rising costs. AI tools can potentially reduce customer acquisition costs by up to 50%.
Reduce Cart Abandonment Rate
This eCommerce metric calculates the percentage of customers who add products to their carts but don’t complete the purchase. Constantly assessing drop-off rates at checkout can aid businesses in lowering missed sales chances and simultaneously boost funnel efficiency. You can calculate the cart abandonment rate by using the formula below:
Cart abandonment rate = (Number of completed purchases / Number of shopping carts created) x 100
Though cart abandonment rates tend to be high for the eCommerce industry, you should start paying more attention and investigating if they fall between 95% and 100%. One potential issue that could be keeping consumers from completing their purchases is a lengthy and confusing checkout process.
Evaluate Traffic and Channel Performance
Lastly, try to review which channels help in luring the maximum number of target audiences. Further, try to allocate budgets according to the most efficient performers.
Improve Click-Through Rate (CTR)
CTR measures the percentage of users who click on your ad or link after seeing it in search results. CTR indicates engagement. It helps you assess the effectiveness of ads, emails, and calls-to-action (CTAs). A higher CTR often suggests that your message, creative, or offer is resonating with your audience, while a low CTR usually means your offer isn’t compelling enough. You can use the formula below to calculate it:
CTR = (Number of clicks / Number of views or impressions) × 100
Minimise Return and Refund Rate
This eCommerce metric tracks the percentage of products your customers return, exchange, or ask to be refunded for. High return rates can eat into your profit margins and damage customer trust in the long run. A high return rate often indicates issues with product quality, misleading product descriptions, sizing problems (particularly for clothing businesses), or other product-related problems. It can also mean that your products aren’t meeting customer expectations. Here’s how you can calculate the return rate:
Return rate = (Number of returned items / Total items sold) × 100
The average return rate in the eCommerce industry generally falls between 20% and 30%. In India, return order volume for online purchases was 15.8% in 2022, a drop from over 17% in the previous year, according to Statista. Most of these product returns came from the fashion segment, particularly apparel and footwear. Similarly, the India eCommerce Index Report 2023 by Unicommerce also revealed that clothing consistently ranks as the most returned category, with return rates ranging between 25% and 40%.
Churn Rate
The churn rate measures the percentage of customers who stop buying from you over a specific period. This eCommerce metric is especially important for subscription-based or repeat-purchase business models. A high churn rate often means customers aren’t satisfied with your products, or your brand in general, or see no reason to return. You can use the formula below to calculate the churn rate.
Churn rate = (Number of customers lost / Total number of customers at the start of the period) × 100
According to Recurly, the average churn rate for any subscription-based eCommerce business is 5%. The average churn rate for the eCommerce industry, in general, can fall anywhere between 70% and 80%.
Reduce Bounce Rate
Bounce rate tells you the percentage of visitors who leave your website after viewing only one page. It’s an important eCommerce metric for your landing and product pages. A high bounce rate can mean poor UX, slow load times, irrelevant content, or weak CTAs. It can also indicate that your content doesn’t align with the user’s search query. Here’s how you can calculate the bounce rate:
Bounce rate = (Number of single-page visits or sessions / Total sessions) × 100
As an eCommerce business, you should aim for an average bounce rate of 30% to 55%. If your eCommerce website has a bounce rate of less than 45%, it’s a healthy sign. However, if the bounce rate is above 55%, it could mean problems with your website, user experience, etc.
How Frequently Should You Track Metrics?
The frequency of monitoring your metrics depends on the sort of data you deal with and how efficiently your business moves. Many businesses review key areas such as cart abandonment, page visits, traffic, and conversions weekly. This review allows businesses to identify issues early and proactively enhance their strategies.
Daily tracking is ideal during sales or when you encounter high traffic, particularly for real-time efficiency indicators such as ad spend or order volume.
On the other hand, monthly tracking is best suited for metrics that change slowly, such as average order value, customer retention, and revenue trends. This can empower businesses to gain exhaustive clarity on their growth and marketing efficiency.
No matter the frequency of tracking metrics, businesses should maintain consistency to review their KPIs to boost performance regularly.
Mapping the Customer Journey with Data-Driven Metrics
Customers are a substantial aspect of company success, and thus, understanding them is quintessential to enhancing their experience and ultimately boosting sales. Businesses should leverage data-driven metrics at every level to determine at which stages their customers stay engaged and when they drop off.
Traffic sources are handy when analysing where the traffic emerged from. Bounce rate and time on site are metrics that help assess how well your website keeps customers engaged. Further into the funnel, add-to-cart rate, product views, and checkout initiation help understand buying intent and customer interest.
From this point, the conversion rate helps determine the total number of customers who make a purchase. A funnel also includes first-purchase metrics such as net promoter score, repeat purchase rate, and customer lifetime value, which facilitate measuring customer loyalty and satisfaction.
Each step of the funnel should be mapped with appropriate metrics to see a complete picture of what might be working and what needs to be improved. This can greatly assist in bettering customer experiences and driving long-term success.
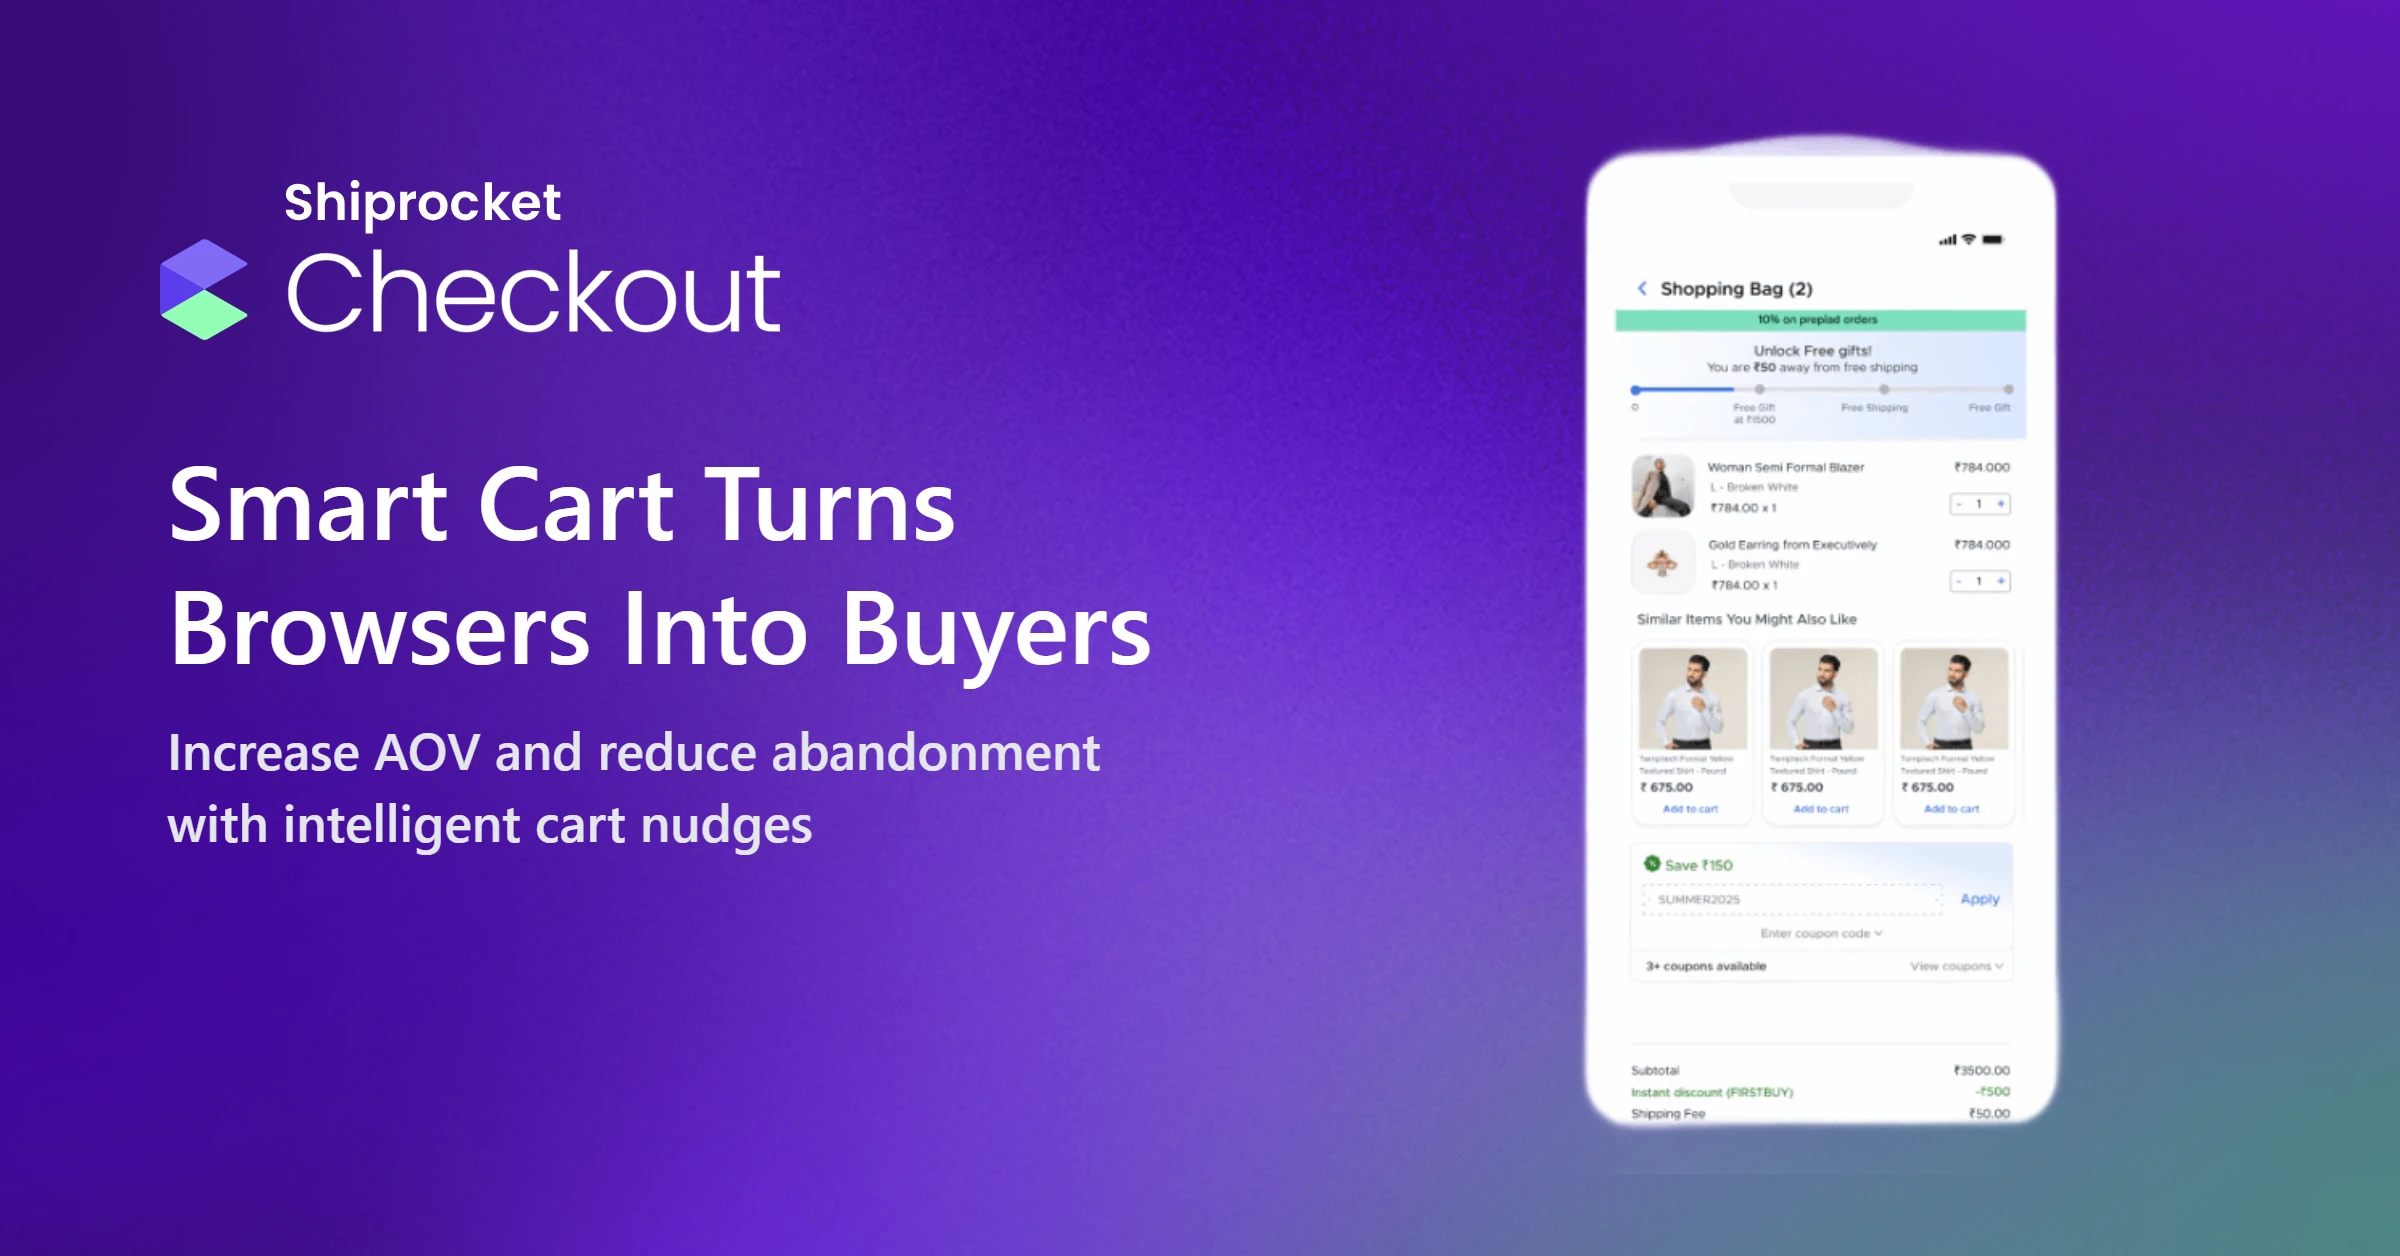
How Shiprocket Checkout Helps Track and Improve Conversion Metrics
The last stage of the sales funnel (checkout) is where buyer momentum meets possible friction. A slight intricacy can hinder a potential conversion. Shiprocket Checkout comes in handy at this stage, helping businesses simplify the process and, most importantly, monitor metrics that impact your business the most.
Businesses can gain meticulous data on fundamental conversion-related figures like:
- Drop-off rate at every stage of checkout
- Checkout initiation vs. competition rate
- Channel-wise and device-wise performance and page-load times
- Payment mode success and failure rates
By regularly tracking these metrics, businesses can thoroughly assess at which point customers are exiting and make a crucial decision—whether to accelerate load time, automate from fields, or introduce flexible payment options.
Additionally, websites should incorporate mobile-friendly features and one-page experiences to reduce severe cart abandonment rates and multiply conversions.
We also aid in effortless A/B testing of factors like field layout, CTA placement, promo messaging, and so on, thus allowing businesses to create more memorable shopping experiences for their customers.
We do more than just allow businesses to complete transactions smoothly; we offer all the data they need to enhance their operational strategies.
Conclusion
Monitoring the right eCommerce metrics goes beyond just accumulating figures. It is more about making better, more informed decisions that lead to business growth. From cart abandonment rates to conversion rates, each metric plays an indispensable role in boosting your business’s efficiency.
Focus on the KPIs that align optimally with your core business objectives. This will help you understand what may be working for your business and what needs improvement.
Shiprocket Checkout is a pioneer in offering businesses a competitive advantage by simplifying the purchase process and allowing them to access data to refine their marketing strategies.
Review your performance regularly and study insights to offer more satisfying customer experiences, lower drop-off rates, and accelerate growth.